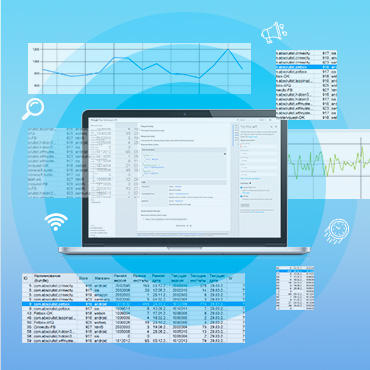
Game User Behavior Analysis
Designed for the gaming industry, it provides valuable insights into player data and engagement. With automated reporting, customizable reports, and KPI tracking, our solution helps developers, marketers, and designers make data-driven decisions for game improvement and monetization strategies. Compatible across platforms and capable of handling large data volumes, our user-friendly system ensures reliable and actionable analytics.

 Business Challenge
In the modern gaming industry, it is impossible to create a successful mobile or social project without processing huge amounts of data. Many game analytics tools are used to design and support products, develop marketing and monetization strategies. Depending on the goal, there can be few of them in a single project.
Analysts have to create protocols and formats for data acquisition, invent methods to process it and forecast possible issues. Furthermore, based on the data obtained, they have to justify introduced modifications, i.e. how to solve current challenges, which KPIs can confirm the assumptions, and how to check if the changes have improved the situation.
Usability, reporting transparency, easy processing of the input data, reliability and consistency with partner data are secondary goals, but rather time-consuming.
 Solution Overview
For the Game Processes Analysis, Qudata developed almost a comprehensive KPI tracking system from scratch. The project required close cooperation with the customer's team, including developers, marketers and game designers.
Constant monitoring of user engagement is the integral part of game development nowadays. Thus, top performing apps analyze user activity in terms of their interest in different game features, for example, replaying certain locations, passing minigames, participating in tournaments, and the effect of various bonuses on player engagement. The project implied reporting automation, so that analytical and control data was retrieved at various intervals. The system provides for generating a customizable set of reports for select products, allowing both to reflect the current project performance and forecast player behavior using segmentation, conversion analysis, entry funnel, A/B testing, shopping behavior analysis etc. Among the most important indicators are LTV, churn rate, DAU, MAU, ARPPU, retention rate for different time periods.
Anticipation of player behavior (e.g. the expected session duration) is based on stats for the previous period and behavior model, with result segmentation depending on various parameters, including solely using players’ behavior in the game, but not their private data.


 Technical Details
The technological stack of this project is multi-vector. On the one hand, industry standard APIs and SDKs were used, such as Flurry, Google Analytics and Firebase. On the other hand, services for collecting and storing information were built and adapted for specific games and applications. MySQL database servers were used to store information. This choice of technology provided for high reliability and simple querying for analysts.
Proprietary service allows for joint analysis across many platforms: Android, iOS and web (social networks).
The technology provides an opportunity to integrate with apps and games developed using various engines and programming languages.
The programming languages Python and JavaScript were used to build the reports.
Python and JavaScript were used to build the reporting system.
The volume of processed data can measure up to several gigabytes a day for a single application, which implied the development of a protocol and format for transmitting information packets, ensuring minimal data loss with low device requirements.
Technology Stack

MySQL

MariaDB

MongoDB

NodeJS

